


S&P 500 and Nasdaq record new all-time high values
- The value of the S&P 500 climbed to a new all-time high on Friday at the 5375.7 level.
- The Nasdaq rose to 19116.5 on Friday night, forming a new all-time high.
S&P 500 chart analysis
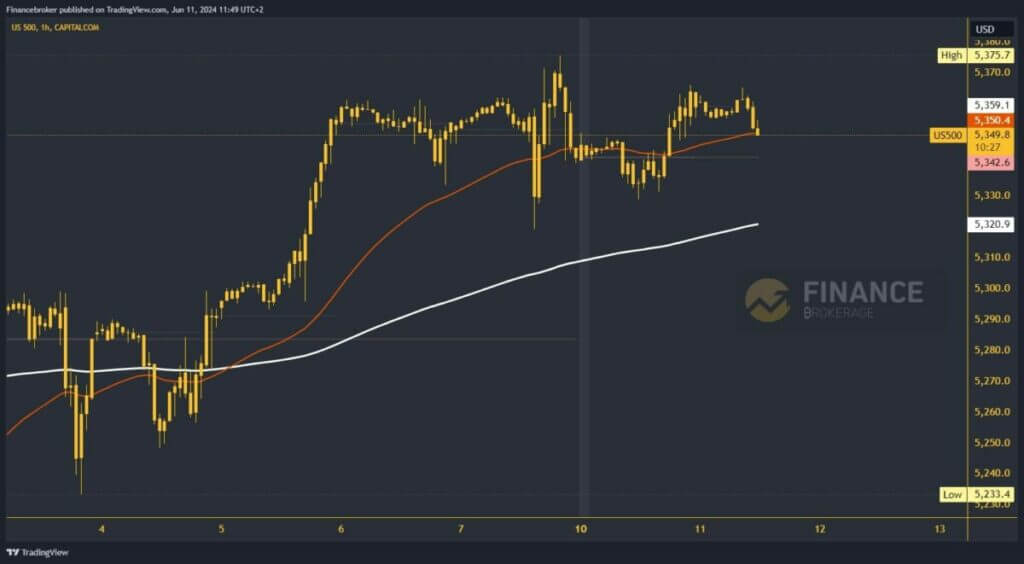
The value of the S&P 500 climbed to a new all-time high on Friday at the 5375.7 level. By the time the market closed, the price had retreated to 5342.0 levels. Yesterday’s movement was in the 5330.0-5365.0 range. Today, we continue in the same range, and so far we have failed to move above the upper line. The index has initiated a pullback to 5350.0 in the last few hours, testing the EMA50 moving average here.
Looking ahead, it’s possible that we will test the daily open price before finding new support. Potential higher targets are 5370.0 and 5380.0 levels, indicating a bullish trend. However, for a bearish option, we need to see a drop below the 5340.0 level. We are gradually moving below the weekly open price to the negative side, suggesting a potential downward trend. Additional support in the 5320.0 zone is the EMA200 moving average, which could provide a strong support level.
Nasdaq chart analysis
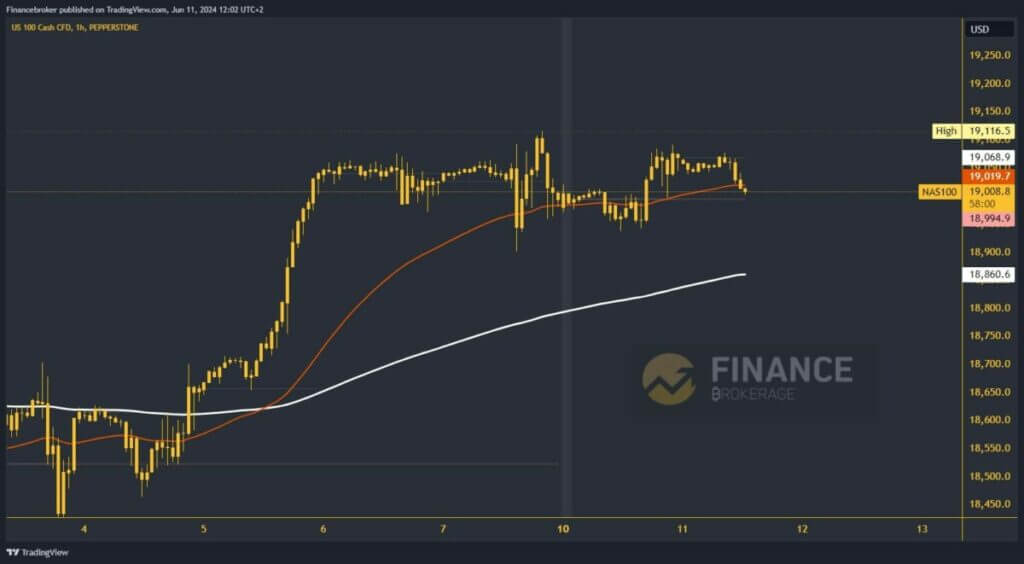
The Nasdaq rose to 19116.5 on Friday night, forming a new all-time high. Yesterday and today, the index movement occurred in the 18950.0-19100.0 range. The index have resistance at the upper line and pull back to the 19000.0 level. We could also test the weekly open price before we initiate further growth to the bullish side. We are not ruling out a pullback below and are testing this week’s support at 18950.0.
Potential lower targets are 18900.0 and 18850.0 levels. Additional major support would be at the 18850.0 zone in the EMA200 moving average. We need a positive consolidation and growth above the 19100.0 level for a bullish option. We are within reach of the previous high and will have the opportunity to climb to a new one. Potential higher targets are 19150.0 and 19200.0 levels.
The post S&P 500 and Nasdaq record new all-time high values appeared first on FinanceBrokerage.