


Oil and Natural Gas: Oil remains under pressure below $70.00
- The oil price rose to $69.77 on Thursday, a new weekly high
- This week’s strong bullish consolidation pushed the price of natural gas to the $2.55 level on Thursday
Oil chart analysis
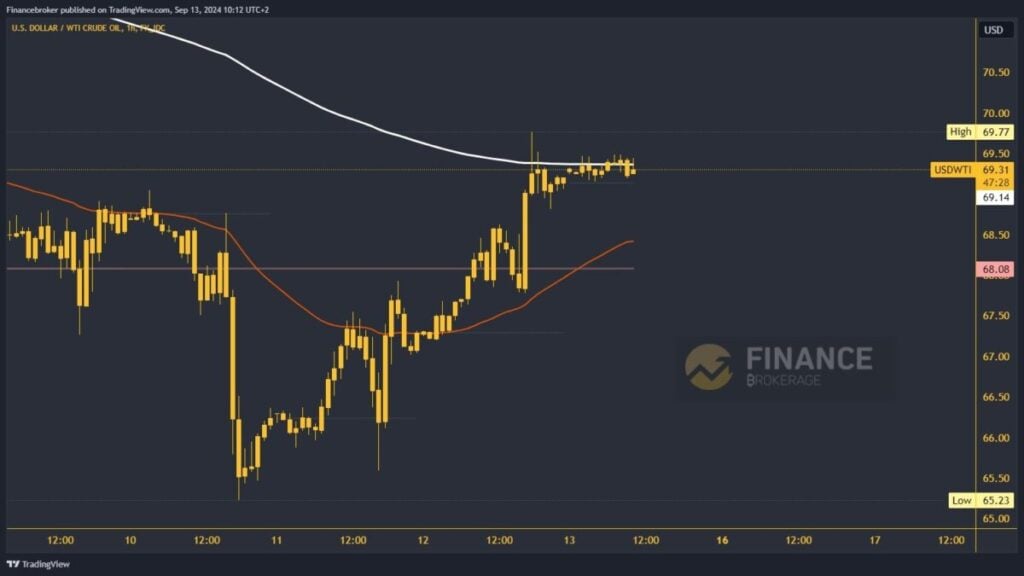
The oil price rose to $69.77 on Thursday, a new weekly high. Shortly after its formation, the price lost its previous momentum and stopped further growth. During this morning’s Asian session, the movement took place in the $69.15-$69.50 range. We are in the EMA 200 moving average zone, which could be a problem for us to continue to the bullish side. It is successful that we stay above the daily open price, giving us hope that oil could still be above the EMA 200 and the $69.50 level.
Potential higher targets are the $70.00 and $70.50 levels. For a bearish option, we need a pullback below the daily open price of $69.14. With that step, we descend to a new daily low and strengthen the bearish momentum. After that, oil should begin to retreat further. Potential lower targets are $68.50 and $68.00. A big test for the price is the weekly open level in the $68.00 zone.
Natural gas chart analysis
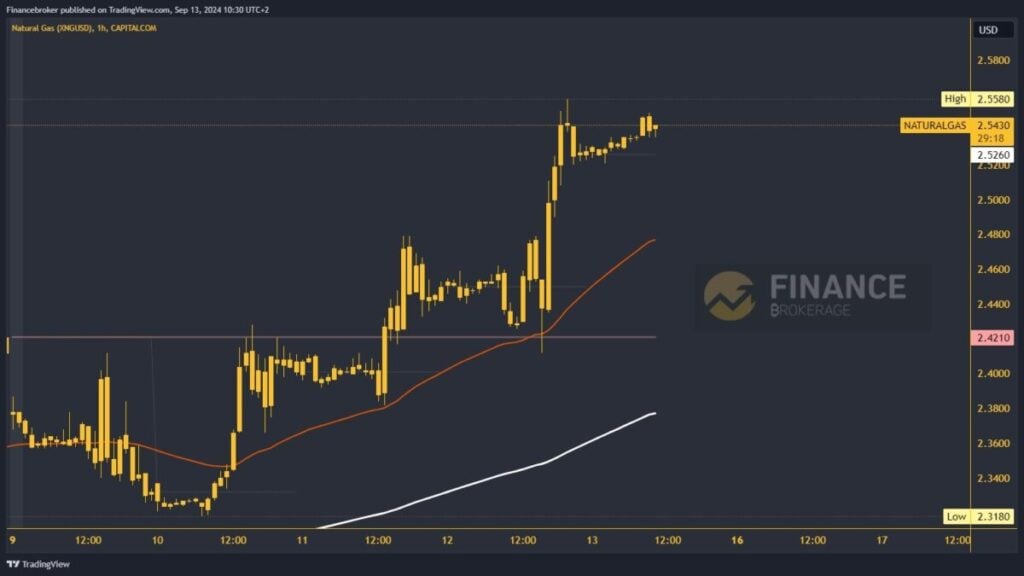
This week’s strong bullish consolidation pushed the price of natural gas to the $2.55 level on Thursday. After forming a new high, the price retreated slightly to the $2.52 support level. During this morning’s Asian trading session, we saw the re-formation of a bullish consolidation and price recovery to $2.55. We expect to see a further advance to the bullish side and form a new weekly high.
Potential higher targets are the $2.56 and $2.58 levels. For a bearish option, we need a drop below the daily open price. With the formation of a new daily low, we can expect greater pressure on the price of natural gas to seek new lower support. Potential lower targets are the $2.52 and $2.50 levels. The first major support is in the $2.48 zone in the EMA 50 moving average.
The post Oil and Natural Gas: Oil remains under pressure below $70.00 appeared first on FinanceBrokerage.